A Custom Status Line for Claude Code
Claude Code has a configurable status line that runs a shell command and displays the output at the bottom of your terminal. It pipes a JSON blob to your script’s stdin with session metadata – model info, context window usage, rate limits, workspace details, and more. Here’s what I’m running with.
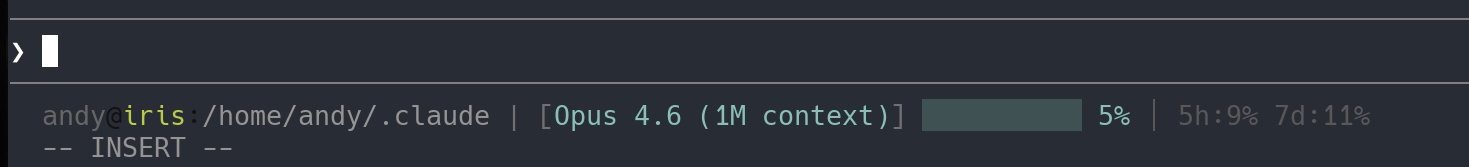
What it shows
Left to right:
- user@host:path – styled to match my zsh prompt, color-coded by hostname
- Model – e.g.
Opus 4.6 (1M context) - Context window – a 10-character progress bar with percentage, color shifts from cyan to yellow at 75% and red at 90%
- Rate limits –
5h:42% 7d:18%showing the 5-hour and 7-day usage windows, also color-coded by severity - Git info – branch name, remote icon (GitHub/Gitea/GitLab), and dirty/clean status
Configuration
In ~/.claude/settings.json:
{
  "statusLine": {
    "type": "command",
    "command": "~/.claude/statusline.sh"
  }
}
Claude Code pipes a JSON object to your script’s stdin on every update. The fields that matter here:
.model.display_name                        # "Opus 4.6 (1M context)"
.workspace.current_dir                     # "/home/andy/projects/foo"
.context_window.used_percentage            # 0-100, pre-calculated
.rate_limits.five_hour.used_percentage     # 0-100, 5-hour rolling window
.rate_limits.seven_day.used_percentage     # 0-100, weekly limit
The rate_limits fields are available for Claude.ai Pro/Max subscribers after the first API response in a session. The context_window.used_percentage is always available.
The script
#!/bin/bash
input=$(cat)

# Extract Claude Code context
MODEL=$(echo "$input" | jq -r '.model.display_name // "unknown"')
CWD=$(echo "$input" | jq -r '.workspace.current_dir // "."')
CTX_USED_PCT=$(echo "$input" | jq -r \
  '.context_window.used_percentage // 0' | xargs printf '%.0f')

# Rate limits from Claude Code (passed in input JSON)
FIVE_HOUR_PCT=$(echo "$input" | jq -r \
  '.rate_limits.five_hour.used_percentage // empty')
SEVEN_DAY_PCT=$(echo "$input" | jq -r \
  '.rate_limits.seven_day.used_percentage // empty')
[ -n "$FIVE_HOUR_PCT" ] && FIVE_HOUR_PCT=$(printf '%.0f' "$FIVE_HOUR_PCT")
[ -n "$SEVEN_DAY_PCT" ] && SEVEN_DAY_PCT=$(printf '%.0f' "$SEVEN_DAY_PCT")

# ANSI colors
DIM='\033[2m'
RESET='\033[0m'
GRAY='\033[38;5;233m'
VERY_DIM='\033[38;5;240m'
CYAN='\033[36m'
YELLOW='\033[33m'
RED='\033[31m'

# Color code context usage
if [ $CTX_USED_PCT -ge 90 ]; then
    CTX_COLOR=$RED
elif [ $CTX_USED_PCT -ge 75 ]; then
    CTX_COLOR=$YELLOW
else
    CTX_COLOR=$CYAN
fi

# Color code rate limits (muted unless high)
rate_limit_color() {
    local pct=$1
    if [ "$pct" -ge 90 ] 2>/dev/null; then
        echo '\033[38;5;167m'
    elif [ "$pct" -ge 75 ] 2>/dev/null; then
        echo '\033[38;5;179m'
    else
        echo "$VERY_DIM"
    fi
}

# Render a progress bar
render_bar() {
    local pct=$1 width=$2 color=$3
    local filled=$(( pct * width / 100 ))
    [ $filled -gt $width ] && filled=$width
    local empty=$(( width - filled ))
    local bar=""
    for ((i=0; i<filled; i++)); do bar="${bar}█"; done
    for ((i=0; i<empty; i++)); do bar="${bar}░"; done
    echo -n "${color}${bar}${RESET}"
}

CTX_BAR=$(render_bar $CTX_USED_PCT 10 "$CTX_COLOR")

# Rate limit string
RATE_STR=""
if [ -n "$FIVE_HOUR_PCT" ] || [ -n "$SEVEN_DAY_PCT" ]; then
    FIVE_COLOR=$(rate_limit_color "$FIVE_HOUR_PCT")
    SEVEN_COLOR=$(rate_limit_color "$SEVEN_DAY_PCT")
    RATE_STR=" ${VERY_DIM}│${RESET}"
    [ -n "$FIVE_HOUR_PCT" ] && \
      RATE_STR="${RATE_STR} ${FIVE_COLOR}5h:${FIVE_HOUR_PCT}%${RESET}"
    [ -n "$SEVEN_DAY_PCT" ] && \
      RATE_STR="${RATE_STR} ${SEVEN_COLOR}7d:${SEVEN_DAY_PCT}%${RESET}"
fi

# Git info
GIT_INFO=""
if git rev-parse --is-inside-work-tree &>/dev/null; then
    BRANCH=$(git branch 2>/dev/null | grep '*' | cut -d' ' -f2)
    if [[ -n $(git status -s 2>/dev/null) ]]; then
        STATUS="✗"
    else
        STATUS="✓"
    fi
    GIT_INFO=" ${BRANCH} ${STATUS}"
fi

USER=$(whoami)
HOST=$(hostname -s)

echo -ne "${USER}@${HOST}:${CWD} ${DIM}|${RESET}" \
  " ${DIM}[${RESET}${CYAN}${MODEL}${RESET}${DIM}]${RESET}" \
  " ${CTX_BAR} ${CTX_COLOR}${CTX_USED_PCT}%${RESET}" \
  "${RATE_STR}${GIT_INFO}"
This is a slightly simplified version of what I actually run – the real one has per-host color theming and git remote icons – but the core is the same. The key insight is that Claude Code now provides used_percentage for both the context window and rate limits directly in the input JSON, so you don’t need to calculate anything yourself or shell out to external tools.